Statistical Analysis
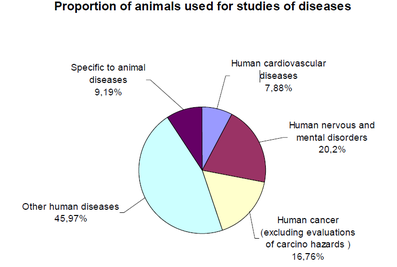
-This graph shows specific diseases tested on animals.
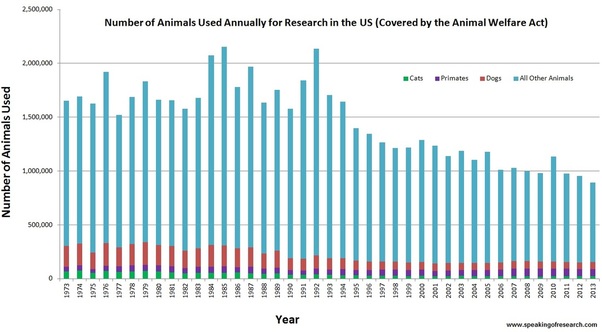
What this image shows is the number of animals used and what type of animals used for medical testing. The types of animals include cats, dogs, primate such as chimpanzees, and other animals, which could include fishes, frogs, etc.
-The graph shows that as time increases, the number of animals used for testing is decreasing.
-The graph shows that as time increases, the number of animals used for testing is decreasing.
